This fully interactive model needs the free Wolfram CDF Player. Once you have it installed the model can be used instantaneously. If you want a larger verson download Waves2 (sliders are not visible in the embedded version).
If it is not installed you get the possibility to do so first. As it is a very powerful program it may need some time to download. It is perfectly safe and has mindboggeling possibilities. Please follow the Link if needed and be patient
Waves2
[WolframCDF source=”https://boomweb.nl/wp-content/uploads/Waves2.cdf” CDFwidth=”600″ CDFheight=”600″ altimage=”file”]
The model can be rotated with the mouse. To the right youn can find the sliders (shrink th figure in the embedded version to see them). Right to these sliders are tiny + buttons and top right is an auto play button: just try them all out!
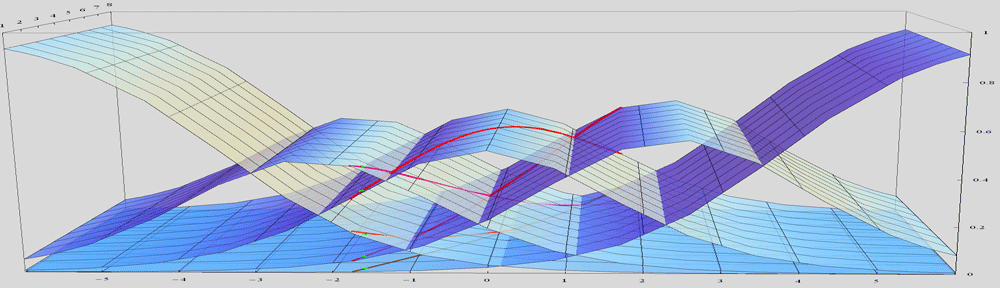
The x-axis represents a.o. individual differences. The units are logits and the midpoint is arbitraily set to zero. In actual data only small part (around zero) of the entire scale range is relevant. The heavy curves all belong to the same single example individual. His/her ability is set with the intercept parameter.
The y-axis represents time or, in this case, occasions of measurements. The surfaces are not changing with time because we want the measurement scale to be invariant. However the individual curves may vary over weeks: the amount of growth for this example individual is set by the slope parameter.
The z-axis represents the likelyhood of using a particular startegy (indexed by the surfaces)
![]()